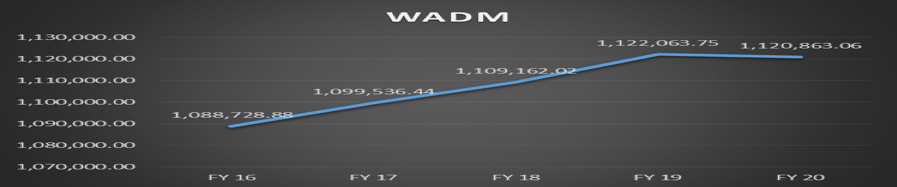
The release of the initial State Aid allocation numbers is always interesting. The most notable trend in the numbers was a surprising decrease of 1,200.69 WADM. We knew there was a high percentage of districts that would be leaving their high year, but the question was where the students would go. Let’s take a look at the actual numbers compared to initial allocations from past years.
There was a decrease of 1,200.69 WADM from July FY19 to July FY20.
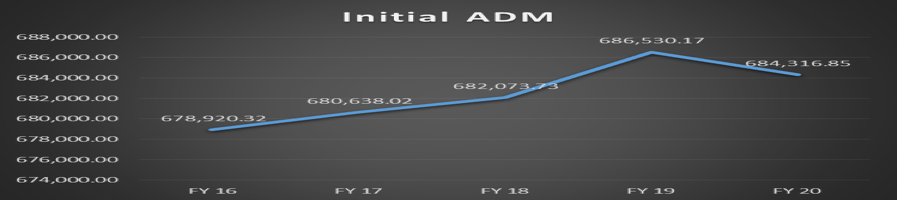
The detail weight sheets confirm the loss of ADM. There was a decrease of 2,213.32 ADM statewide between July FY19 and July FY20.
There were declines in the grade weights, G/T weights and economically disadvantaged student weights. Bilingual and special education showed increases; these two growth areas kept the decline from being more significant.
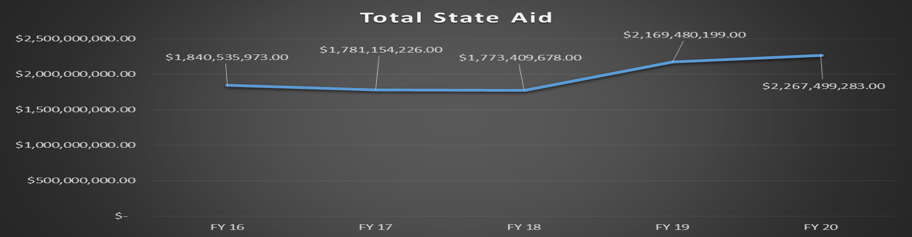
The total State Aid allocations listed and compared below show a significant growth curve.
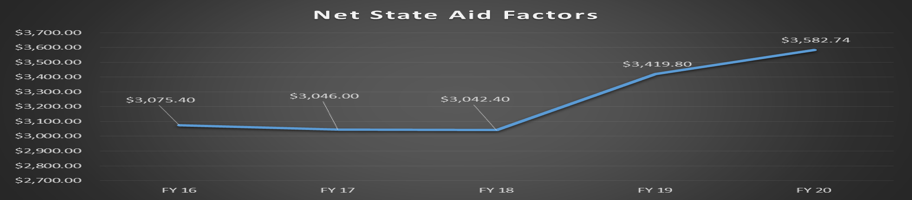
The net State Aid factors show a $162.94 increase over the previous year.
If you are in a district coming off the 3-year high, the higher State Aid factors are a huge benefit. The most surprising drop in the detailed weight sheet was in the decrease of economically disadvantaged students. It would be beneficial to check your district's number gathering process for the economically disadvantaged students to ensure that all available data is provided to the state. If we can help you with this, please let us know. We will send out our next finance report in mid-August, and we will have the chargeable report ready at that time as well.
Share This!
Andy Evans
Director, Finance
Andy serves as the Finance Director for OPSRC. In this role, he provides help in financial and business-related areas for schools. This includes budgets, managing cash flow, Estimate of Needs, federal programs and general service to aid in the effective use of district resources. Additionally, Andy serves as a resource in customizing budget spreadsheets, projection sheets, and other financial tools essential to administrators in maintaining their district’s financial health.
You may also like...
April 6-12 #oklaed News Brief
A collection of Oklahoma education-related news of the week.
The Oklahoma Supplemental Online Course Program (OSOCP)
The Oklahoma Supplemental Online Course Program (OSOCP) is a state program that provides online learning opportunities for K-12 students attending any public school in Oklahoma. One purpose of the OSOCP is to broaden curriculum access and provide advancement opportunities.


.png)

Join in on the conversation